A New Era of Customizable Reporting
For years, digital marketers have relied on a combination of standard reports and the "Explore" section to extract insights from their data. While powerful, this workflow often necessitated jumping between multiple tabs or exporting data into external visualization tools like Looker Studio. The introduction of Dashboards aims to bridge this gap by offering a drag-and-drop, grid-based canvas directly within the Google Analytics interface.
This evolution is designed to cater to the modern marketing team, which often requires a high-level "single source of truth" to monitor daily performance. By allowing users to position, resize, and align visualizations manually, Google is granting teams the autonomy to curate data views that align specifically with their unique business objectives.
Core Functionality and Visualization Capabilities
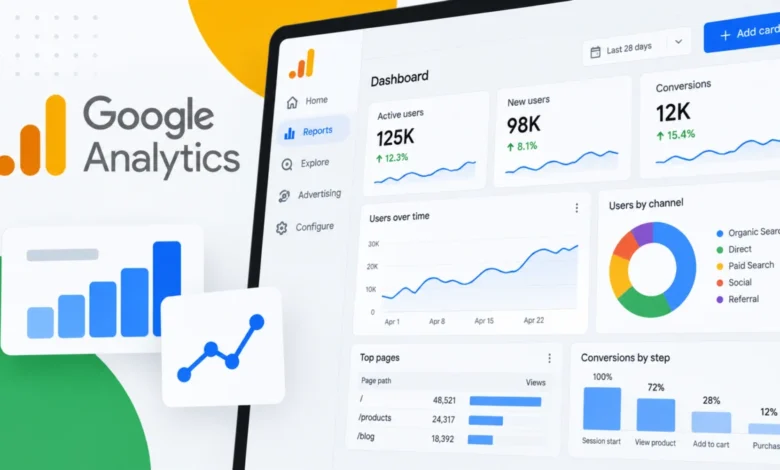
At its core, the new Dashboard functionality is built for speed and accessibility. Users can now drag specific dimensions and metrics directly onto a canvas, eliminating the need to build individual reports from scratch. This streamlined process is supported by six primary visualization types available at launch:
- Scorecards: Designed for high-level KPIs, these include support for percentage change calculations when date comparisons are active.
- Tables: Essential for granular data analysis and detailed reporting.
- Line Charts: Tailored for monitoring performance trends over daily, weekly, or monthly intervals.
- Bar Charts: Ideal for side-by-side comparisons of different categories or segments.
- Donut Charts: Useful for visualizing breakdowns and proportion-based data.
- Funnel Charts: A critical addition for tracking conversion pathways and identifying specific drop-off points in the user journey.
The ability to publish these dashboards directly to the left-hand navigation bar, bypassing the standard library, marks a departure from previous organizational constraints. This ensures that the most relevant data is always a single click away for any stakeholder with access to the property.
Governance and Operational Constraints
While the feature offers significant flexibility, Google has implemented clear governance protocols to ensure consistency across organizations. The creation and publication of these dashboards are restricted to users with Editor or Administrator roles. This safeguard prevents unauthorized or accidental changes to the reporting structure of an organization’s analytics environment.
Once a dashboard is published, it becomes a shared asset for the entire property. Any user with access to the account can view these dashboards, fostering better alignment between marketing, sales, and executive teams. However, there are technical limitations to consider. Standard properties are capped at 15 cards per dashboard, while premium properties—typically those utilizing GA4 360—can accommodate up to 30 cards.

Furthermore, as a Version 1.0 release, certain advanced functionalities remain absent. Currently, the system does not support API integration, custom segments, or card-level comparisons, which may necessitate continued reliance on existing reporting tools for more complex data science requirements.
Chronology and Context: The Evolution of GA4
The release of Dashboards comes at a time when the industry continues to adjust to the sunsetting of Universal Analytics. Since the mandatory migration to Google Analytics 4, user feedback has consistently centered on the platform’s steeper learning curve and the complexity of the reporting interface.
Historically, Google has followed a predictable pattern of iterating on the GA4 platform to address these usability concerns:
- 2022-2023: The focus was primarily on feature parity and the foundational migration from Universal Analytics.
- 2024: Introduction of improved anomaly detection and automated insights, attempting to use machine learning to surface issues.
- 2025: Increased emphasis on data visualization and third-party integration improvements.
- 2026: The current launch of Dashboards signifies a move toward "Report Democratization," where the goal is to make professional-grade reporting accessible to non-technical users.
Industry analysts suggest this update is a strategic move to keep enterprise users within the Google ecosystem. By providing native dashboarding capabilities, Google reduces the incentive for businesses to migrate their primary reporting workflows to external platforms, thereby increasing the stickiness of the GA4 product.
Implications for Marketing Teams
The primary benefit of this launch is the consolidation of the reporting workflow. For the average marketing team, performance monitoring is often a fragmented task. A manager might monitor traffic in one report, conversion rates in another, and specific campaign performance in a third.
By unifying these metrics on a single-page view, teams can significantly reduce the "context switching" that often leads to errors or overlooked data points. For instance, a growth marketer can now place a funnel chart next to a line chart of daily sessions, allowing for immediate visual correlation between traffic spikes and conversion behavior.
Moreover, the efficiency gains extend to reporting cycles. Rather than manually exporting data to prepare weekly executive summaries, managers can simply curate the dashboard to serve as a live, real-time performance monitor. This transition from "retrospective reporting" to "real-time monitoring" is a hallmark of high-maturity data organizations.

Fact-Based Analysis of the Current Landscape
While the addition of Dashboards is a welcome improvement, it is important to contextualize this against the broader analytics market. Competitors such as Adobe Analytics, Mixpanel, and Amplitude have long prioritized intuitive, drag-and-drop dashboarding as a core pillar of their UX.
Google’s late entry into this specific design paradigm for GA4 suggests a recalibration of their product roadmap. The challenge for Google moving forward will be balancing the simplicity requested by casual users with the depth required by data scientists. The current lack of API support and segment filtering indicates that this tool is aimed primarily at the "middle market"—businesses that require professional reporting but do not have the resources to maintain complex, custom-coded data pipelines.
Future Expectations
As Google continues to develop this feature, industry experts anticipate several key updates in the coming months. These likely include:
- Expanded Filtering: The introduction of global filters that allow users to toggle entire dashboards by source/medium, country, or device category.
- API Integration: Enabling the programmatic retrieval of dashboard data for use in proprietary executive portals.
- Enhanced Sharing Permissions: Granular controls that allow for the sharing of dashboards with external stakeholders without granting full property access.
Final Assessment
The introduction of Dashboards into Google Analytics is a foundational improvement that addresses one of the most common criticisms of the platform: its lack of a native, highly customizable summary view. For teams looking to streamline their daily operations, this feature offers a clear path toward better data visibility and improved decision-making.
While the feature is currently in its nascent stages—evidenced by the card limits and lack of advanced segmentation—it establishes a new standard for how Google expects users to interact with their data. As businesses move further into the era of data-driven decision-making, the ability to rapidly synthesize and visualize KPIs will become a competitive advantage. For organizations already embedded in the Google Analytics 4 environment, this update provides a much-needed bridge between raw data collection and actionable, executive-ready insight.