OKR for analytics team is crucial for driving impactful results. This guide dives deep into defining, implementing, and measuring OKRs tailored for analytics teams, from translating business goals to fostering a data-driven culture. We’ll explore examples, metrics, and best practices to ensure your analytics team achieves its full potential.
This detailed guide provides a comprehensive overview of setting Objectives and Key Results (OKRs) for analytics teams. It covers everything from defining clear objectives and key results to measuring progress, aligning analytics efforts with business strategy, and overcoming common challenges.
Defining OKRs for Analytics Teams
OKRs (Objectives and Key Results) are powerful tools for aligning teams around strategic goals. For analytics teams, well-defined OKRs translate business needs into measurable achievements, fostering a data-driven culture and demonstrating the value of the analytics function. Effective OKRs ensure the team is focused on the right priorities, leading to improved performance and increased impact.Analytics teams, by their nature, are often at the forefront of understanding and interpreting data to support business decisions.
By implementing well-structured OKRs, they can demonstrate their value in a tangible way, and effectively contribute to the overall success of the organization.
Defining Objectives and Key Results for Analytics Teams
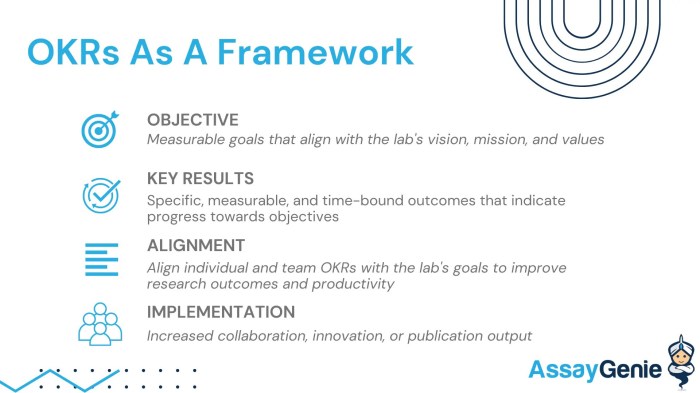
Objectives are the overarching goals the analytics team aims to achieve. They should be ambitious but achievable, focusing on areas where the team can significantly impact the business. Key Results are the measurable steps the team will take to achieve those objectives. These results should be quantifiable and time-bound.
Key Characteristics of Effective OKRs for Analytics Teams
Effective OKRs for analytics teams possess several key characteristics:
- Alignment with Business Strategy: OKRs should directly support the overall business strategy. This means understanding the company’s objectives and translating them into actionable steps for the analytics team.
- Measurable and Time-Bound Key Results: Avoid vague or subjective metrics. Instead, use specific, quantifiable metrics with clear targets and deadlines. For example, instead of “improve customer satisfaction,” a more effective Key Result would be “Increase customer satisfaction score by 15% by Q3 2024.”
- Focus on Impact and Value: The OKRs should highlight the tangible impact the analytics team will have on the business. Quantify the value created by the analytics team’s work, such as increased revenue, reduced costs, or improved customer retention.
- Regular Monitoring and Evaluation: Regular check-ins and progress reviews are crucial. This ensures the team stays on track and adjustments can be made as needed.
- Transparency and Communication: Open communication about progress, challenges, and adjustments is vital for team alignment and buy-in. This includes transparency with stakeholders outside the analytics team.
Translating Business Goals into Analytics OKRs
Translating broad business goals into specific OKRs requires careful consideration of the analytics function’s role. This involves:
- Identifying relevant business goals: Analyze the company’s strategic objectives and identify those where analytics can play a significant role. For instance, if the company aims to increase sales, the analytics team can focus on optimizing marketing campaigns or identifying high-value customer segments.
- Defining the analytics team’s contribution: Determine how the analytics team will contribute to achieving the business goal. This could involve developing predictive models, analyzing customer behavior, or providing data-driven insights.
- Developing measurable Key Results: Translate the contribution into quantifiable metrics. For example, if the goal is to improve customer retention, a Key Result could be “Increase customer retention rate by 10% in the next quarter.”
OKR Template for Analytics Teams
| Objective | Key Result 1 | Key Result 2 | Key Result 3 | Target Date |
|---|---|---|---|---|
| Improve customer churn prediction accuracy | Increase model accuracy by 15% | Reduce false positive churn predictions by 10% | Implement a new churn prediction model by Q2 2024 | Q3 2024 |
This template provides a structured approach to defining OKRs for analytics teams. It emphasizes clear objectives, measurable key results, and a well-defined timeframe.
Example OKRs for Analytics Teams
Setting clear Objectives and Key Results (OKRs) is crucial for analytics teams to focus their efforts and measure their impact effectively. Well-defined OKRs provide a roadmap for achieving tangible results and aligning the team’s work with broader company goals. This section provides concrete examples of OKRs for different areas of focus within an analytics team.These examples highlight how OKRs can be tailored to specific team goals and roles, enabling individual contributors to contribute meaningfully to the overall success of the analytics function.
The key is to ensure that the OKRs are ambitious yet achievable, measurable, and time-bound.
Improving Data Quality
Data quality is paramount for accurate insights and reliable decision-making. These OKRs focus on enhancing the reliability and consistency of the data used by the company.
- Objective: Increase the accuracy of key data sources by 15%. Key Results:
- Reduce data entry errors by 10% within Q3 2024.
- Implement data validation checks on 80% of critical data fields by the end of Q4 2024.
- Achieve a 95% data completeness rate for customer demographics by Q4 2024.
- Objective: Improve data consistency across systems by 20%. Key Results:
- Standardize data formats for all key metrics by Q2 2024.
- Develop and implement a data governance framework for all data sources by Q3 2024.
- Reduce data discrepancies between different systems by 10% by Q4 2024.
Increasing Data Utilization
Maximizing data utilization across the company is essential for unlocking its full potential. These OKRs focus on promoting data-driven decision-making throughout the organization.
- Objective: Increase the number of teams using analytical dashboards by 25%. Key Results:
- Develop and launch 3 new dashboards focused on key business functions by Q3 2024.
- Provide training sessions on dashboard usage for 50 internal stakeholders by Q4 2024.
- Achieve a 20% increase in dashboard usage by Q4 2024, measured by active user logins.
- Objective: Drive adoption of data-driven insights in strategic decision-making. Key Results:
- Present data-driven recommendations to 3 key stakeholders by Q2 2024.
- Integrate data-driven insights into 2 key strategic documents by Q4 2024.
- Increase the number of strategic decisions informed by data by 15% by Q4 2024, measured by documented use of data in decision rationale.
Enhancing Data Visualization Capabilities
Improved data visualization allows for more effective communication and comprehension of complex data patterns. These OKRs focus on enhancing the team’s ability to present data insights in an accessible and compelling manner.
- Objective: Enhance data visualization capabilities by 10%. Key Results:
- Develop and implement a new data visualization tool for internal use by Q2 2024.
- Train 20 data analysts on the new data visualization tool by Q3 2024.
- Create 5 new data visualizations demonstrating key insights for Q4 2024, showing an increase in data insight clarity.
- Objective: Improve the effectiveness of data presentations. Key Results:
- Receive positive feedback from 75% of presentation recipients by Q3 2024.
- Implement a new data storytelling framework for all presentations by Q4 2024.
- Increase the number of presentations that result in actionable insights by 15% by Q4 2024.
Tailoring OKRs to Roles
OKRs can be customized to address the specific responsibilities of different roles within the analytics team.
- Data Analyst: Focus on improving data quality and efficiency in data collection and processing. Examples: improving data entry accuracy, automating data cleaning processes, and reducing data processing time.
- Data Scientist: Focus on leveraging advanced analytics to gain deeper insights and predict future trends. Examples: developing predictive models, creating machine learning algorithms, and identifying new data patterns.
Metrics and KPIs for Analytics OKRs
Defining clear metrics and KPIs is crucial for effectively tracking progress and demonstrating the value of an analytics team’s contributions. These quantifiable measures provide a tangible way to assess the success of initiatives, ensuring alignment with overall business objectives. Without concrete metrics, it becomes challenging to demonstrate the impact of data analysis and justify resource allocation.A robust system of metrics allows for ongoing monitoring and adjustment of strategies.
This enables the team to stay on track and optimize their performance based on real-time data, driving continuous improvement and maximizing the impact of their efforts.
Key Performance Indicators (KPIs) for Analytics Team OKRs
Establishing relevant KPIs is fundamental to measuring the effectiveness of the analytics team. These KPIs should directly reflect the objectives and strategic goals of the organization. Choosing the right KPIs ensures that the analytics team’s work aligns with the overall business strategy.
- Data Quality Metrics: Accuracy, completeness, consistency, and timeliness of data are critical aspects of data quality. Monitoring these aspects provides insights into the reliability of data used for analysis.
- Data Visualization Effectiveness: Assessing the clarity, comprehensiveness, and usability of dashboards and visualizations is essential. Metrics like user engagement (time spent on dashboards, clicks on visualizations), feedback on dashboard design, and the rate of adoption by stakeholders can be used to measure the impact of visualizations.
- Data-Driven Insight Impact: Measuring the impact of insights on business decisions involves quantifying the outcomes resulting from recommendations. This includes metrics like the number of actionable insights generated, the adoption rate of recommendations, the return on investment (ROI) achieved from data-driven decisions, and the reduction in costs or increase in revenue associated with insights.
- Timeliness of Analysis: The speed at which insights are generated and delivered to stakeholders is critical. Metrics like average time to deliver reports, response time to queries, and the frequency of reporting can gauge the efficiency of the analytics team.
Metrics for Tracking Data Quality
Data quality is paramount for reliable analysis. Accurate, complete, and consistent data are essential for producing meaningful insights. Measuring data quality involves tracking various metrics.
- Accuracy Rate: Percentage of data points that are accurate and free from errors.
- Completeness Rate: Percentage of data fields that are populated with valid information.
- Consistency Rate: Percentage of data values that adhere to predefined standards and rules.
- Data Integrity Checks: Regular checks to identify and resolve inconsistencies and inaccuracies in data, such as missing values, incorrect data types, or duplicate entries.
- Data Validation Rules: Implementing validation rules to ensure that data adheres to specified formats and constraints.
Measuring Effectiveness of Data Visualizations and Dashboards
Effective visualizations are key to communicating insights clearly and concisely. Dashboards should be user-friendly and easily accessible.
- Dashboard Usage Metrics: Tracking the number of users accessing dashboards, the average time spent on the dashboards, and the frequency of dashboard usage.
- User Feedback on Visualizations: Gathering feedback on the clarity, usefulness, and design of dashboards through surveys, polls, or feedback forms.
- Adoption Rate of Dashboards: Monitoring the number of users who are actively using the dashboards and incorporating them into their workflow.
- User Engagement with Visualizations: Tracking clicks, hovers, and interactions with data visualizations.
Measuring Impact of Data-Driven Insights on Business Decisions
The value of analytics lies in its ability to inform business decisions. Quantifying the impact of these decisions is essential.
- ROI of Data-Driven Decisions: Calculating the return on investment achieved from implementing insights generated by the analytics team. This could involve measuring the increase in revenue, cost savings, or improved operational efficiency.
- Number of Actionable Insights Generated: Tracking the number of insights identified that lead to actionable steps.
- Adoption Rate of Recommendations: Monitoring the percentage of recommendations from the analytics team that are implemented by stakeholders.
- Reduction in Costs or Increase in Revenue: Quantifying the financial impact of data-driven decisions on the business, such as cost savings or increased revenue generation.
Aligning Analytics OKRs with Business Strategy
Successfully implementing OKRs for analytics teams hinges on their alignment with the overall business strategy. This crucial connection ensures that the analytical efforts directly support and advance the company’s goals, rather than operating in a vacuum. A well-defined alignment process fosters a shared understanding of priorities and maximizes the impact of analytics initiatives.Effective alignment isn’t a one-time activity; it’s an ongoing process that requires regular review and adjustment.
By establishing clear links between analytics team objectives and business priorities, organizations can ensure that data-driven insights are effectively utilized to drive strategic decision-making and achieve desired outcomes.
Linking Analytics OKRs to Business Objectives, Okr for analytics team
To ensure the analytics team’s OKRs align with the company’s broader goals, the first step is to thoroughly understand the business strategy. This involves familiarizing oneself with the company’s strategic roadmap, including its key initiatives, goals, and target metrics. Analyzing the company’s overall objectives and identifying areas where data insights can provide significant value is paramount. For example, if a company aims to increase market share in a specific region, the analytics team’s OKRs should focus on activities that directly contribute to that objective, such as improving customer segmentation models or optimizing marketing campaigns.
Methods for Aligning with the Strategic Roadmap
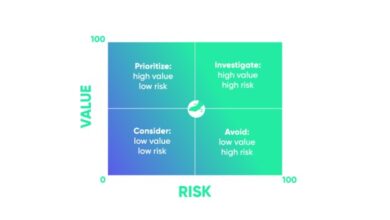
Aligning the analytics team’s OKRs with the company’s strategic roadmap requires a structured approach. A collaborative workshop where the analytics team actively participates in strategy sessions is highly beneficial. This enables the team to understand the context and nuances of the company’s goals and propose data-driven solutions. Consider using a matrix to map business objectives to potential analytics initiatives.
This visual representation helps identify potential overlaps and gaps in analytical efforts.
Ensuring Direct Support of Business Priorities
To guarantee that analytics team efforts directly support business priorities, a crucial step is establishing clear communication channels. Regular meetings between the analytics team and key stakeholders in different departments are vital. These meetings allow for open dialogue, ensuring that analytics projects directly address specific business needs and concerns. By incorporating feedback from stakeholders, the analytics team can ensure its work is relevant and impactful.
Framework for Regular Reviews and Adjustments
Regular reviews and adjustments are essential to maintain the alignment between analytics OKRs and business strategy. Quarterly reviews are a suitable cadence. These reviews should include a thorough analysis of progress towards OKRs, identification of any roadblocks, and adjustments to the analytics team’s approach as needed. Regular communication and feedback loops are crucial to adapt to changing business conditions and ensure the analytics team remains focused on the most impactful initiatives.For instance, if a key business objective shifts, the analytics team’s OKRs should be reassessed and modified accordingly.
This iterative process ensures the analytics team’s efforts always remain aligned with the evolving strategic priorities.
Reporting and Monitoring Analytics OKR Progress
Keeping your Analytics OKRs on track requires a robust reporting and monitoring system. This isn’t just about numbers; it’s about understandingwhy* things are happening and proactively adjusting your strategy. A well-structured approach ensures you’re not just reacting to data, but leveraging it to drive continuous improvement.
Regular Reporting Structure
Regular reporting is crucial for staying informed about progress toward your OKRs. A structured approach helps keep everyone aligned and focused. This involves setting clear reporting intervals (weekly, bi-weekly, monthly) and defining specific metrics to track. A consistent format for reporting is essential for easy comparison and trend analysis.
- Frequency: Establish a regular cadence for reporting, aligning with the overall project timeline and the expected speed of progress on key metrics. Weekly updates are often sufficient for quick adjustments, while monthly reports can provide a broader perspective.
- Metrics: Document the precise metrics and KPIs that will be tracked. This includes both quantitative and qualitative data points. Example metrics could be the number of reports generated, the accuracy of predictive models, or the number of stakeholders engaged with data visualizations.
- Format: Use a standardized format for reports, whether it’s a simple spreadsheet or a more comprehensive dashboard. Consistency allows for easier comparison across reporting periods and helps identify trends.
Dashboard for Visualizing OKR Progress
A dedicated dashboard is a powerful tool for visualizing OKR progress in real-time. It allows for a quick overview of key metrics, trends, and potential roadblocks. This interactive visualization helps the analytics team, leadership, and stakeholders understand the current status and make informed decisions.
- Key Metrics: Identify the crucial metrics directly linked to your OKRs and display them prominently on the dashboard. This might include key performance indicators (KPIs) like customer acquisition cost (CAC), conversion rates, or customer lifetime value (CLTV). Real-time updates are essential.
- Trend Analysis: The dashboard should incorporate trend analysis features to visualize how metrics have changed over time. Line graphs and bar charts are excellent for this. This allows for the identification of positive or negative trends, providing insights into whether the team is on track or needs course correction.
- Customizable Views: Ensure the dashboard is customizable to different user roles and needs. Different stakeholders might require varying levels of detail or different visualizations.
Tracking and Monitoring KPIs
Tracking and monitoring KPIs related to analytics OKRs is essential for maintaining focus and identifying deviations from the expected path. This involves establishing clear criteria for success, documenting performance data consistently, and analyzing the reasons behind any observed variations.
Defining OKRs for the analytics team is crucial for success. We need to focus on key metrics that drive business value. This means tracking user engagement and conversion rates, but also considering broader societal implications, like how internet freedom policies, such as those in the US leading the charge against a new treaty, us leads internet freedom fighters in treaty resistance , impact our data.
Ultimately, the analytics team’s OKRs must adapt to a dynamic environment.
- Data Collection: Implement a structured process for collecting data related to the relevant KPIs. This process should be automated as much as possible to minimize manual effort and potential errors.
- Data Validation: Establish a rigorous process for validating the data collected to ensure accuracy and reliability. This might involve cross-referencing data sources or employing data quality checks.
- Regular Reporting: Schedule regular reporting intervals for monitoring the performance of KPIs. This helps you catch deviations from the expected trajectory early on.
Identifying and Addressing Roadblocks
Proactively identifying and addressing roadblocks is key to maintaining momentum and achieving your OKRs. This involves regular check-ins, feedback mechanisms, and a structured approach to problem-solving.
- Regular Check-ins: Schedule regular meetings to discuss progress and identify any potential roadblocks. This allows the team to address issues before they escalate.
- Feedback Mechanisms: Establish a clear feedback mechanism for team members to report issues or challenges. Open communication channels are crucial for early issue detection.
- Problem-solving Framework: Implement a structured problem-solving framework to address identified roadblocks. This might involve brainstorming sessions, root cause analysis, or other proven methods.
Best Practices for Analytics OKR Implementation
Implementing Objectives and Key Results (OKRs) for analytics teams requires a multifaceted approach that goes beyond simply defining targets. Effective implementation fosters a data-driven culture, motivates the team, and ensures alignment with overall business strategy. This section Artikels best practices for successful OKR integration within an analytics team.
Communicating Analytics OKRs to the Team
Clear and concise communication is crucial for buy-in and understanding. Avoid jargon and technical terms whenever possible, focusing instead on the impact of the OKRs on the team and the broader business. Regular team meetings, dedicated presentations, and visual aids (like dashboards or infographics) can enhance understanding and engagement. Documentation of the OKRs, including the rationale behind them, should be easily accessible to all team members.
This transparency builds trust and fosters a shared understanding of the team’s goals.
Motivating and Engaging the Analytics Team
Motivating analytics teams involves recognizing individual contributions and linking OKR achievements to rewards and career development. Establish a system for acknowledging and celebrating milestones, whether through formal awards, public recognition, or internal communications. Opportunities for professional development, such as training programs or conferences, can boost skills and engagement. Furthermore, fostering a collaborative environment where team members feel valued and empowered to share ideas can lead to increased motivation and innovative solutions.
Creating a safe space for experimentation and feedback is crucial.
Fostering a Culture of Data-Driven Decision-Making
A data-driven culture within the analytics team requires consistent application of data insights across the organization. Highlighting examples of how data-driven decisions have positively impacted the business, both in successes and in course corrections, is essential. Training programs for other departments on how to interpret and use data effectively can also be beneficial. Encouraging the use of data visualizations and reporting tools, making them readily accessible, is another key step.
Regular presentations demonstrating the value of data analysis can solidify its importance.
Conducting Regular Check-ins and Reviews of Analytics OKRs
Regular check-ins and reviews are essential for monitoring progress and making necessary adjustments. Establish a consistent schedule for these meetings, ideally weekly or bi-weekly. These reviews should not only track progress against the OKRs but also identify roadblocks, brainstorm solutions, and gather feedback from the team. Tools for collaborative progress tracking, such as shared spreadsheets or project management software, can streamline the process.
Defining OKRs for an analytics team is crucial. It’s about understanding the impact of data-driven insights, like how “bricks clicks navigating choices in education” bricks clicks navigating choices in education influences student engagement. Ultimately, these goals need to be measurable and directly contribute to the overall success of the team’s analytical work.
Documentation of actions taken and lessons learned during these reviews is critical for future improvement and knowledge sharing.
Overcoming Challenges in Analytics OKR Implementation
Successfully implementing Objectives and Key Results (OKRs) for analytics teams requires a proactive approach to address potential roadblocks. Navigating resource constraints, ensuring data quality, and maintaining team morale are crucial for achieving desired outcomes. This post delves into common obstacles and strategies for overcoming them, empowering analytics teams to effectively utilize OKRs.Implementing OKRs for analytics teams can be challenging, but by understanding and addressing potential obstacles, teams can successfully leverage this framework to drive significant progress.
This article will Artikel some of these obstacles and how to overcome them.
Resource Constraints
Resource constraints often hinder analytics OKR implementation. Budget limitations, insufficient personnel, and inadequate technological resources can all pose significant obstacles. Teams may lack the necessary tools, expertise, or support to fully execute their OKRs.
- Prioritization and Allocation: Clearly define priorities and allocate resources effectively. Focus on essential tools and personnel needed for achieving core OKRs. Evaluate and prioritize tasks based on impact and feasibility, ensuring alignment with team capabilities.
- Seeking Support: Actively seek support from stakeholders, management, and other departments. Justify the need for additional resources, emphasizing the potential return on investment (ROI) of analytics OKR implementation. Explore potential partnerships or collaborations for acquiring necessary tools or expertise.
- Outsourcing/Collaboration: Consider outsourcing specific tasks or collaborating with external experts when needed. Leveraging external resources can be a cost-effective way to fill skill gaps and supplement internal capabilities.
Data Availability and Quality
Data availability and quality are fundamental to the success of analytics OKRs. Insufficient or inaccurate data can lead to unreliable insights and flawed decision-making.
Defining OKRs for the analytics team is crucial for focusing efforts. Thinking about how Watson, that seemingly mild-mannered computer program from mild mannered watson skewers human opponents on jeopardy , consistently outperforms human contestants on Jeopardy! can be a useful analogy. Ultimately, the team needs specific, measurable goals to keep improving data-driven decision-making.
- Data Collection Strategy: Develop a robust data collection strategy to ensure the necessary data is consistently gathered and available. This strategy should include defining data sources, establishing data collection processes, and ensuring data integrity.
- Data Quality Assurance: Establish a rigorous data quality assurance process. This includes data validation, cleaning, and transformation procedures to ensure accuracy and consistency. Regularly monitor and assess data quality to identify and address issues promptly.
- Data Governance: Implement robust data governance policies to maintain data integrity and security. Define clear roles and responsibilities for data management, access controls, and data usage guidelines. This ensures compliance and protects sensitive information.
Maintaining Team Motivation and Engagement
Maintaining team motivation and engagement throughout the OKR cycle is crucial for achieving desired outcomes. Analytics teams can become demotivated if they feel overwhelmed or unsupported.
- Regular Communication: Maintain transparent and regular communication about progress, challenges, and adjustments to the OKRs. This fosters a sense of shared ownership and ensures everyone is aligned. Regular check-ins and feedback sessions are key.
- Recognition and Rewards: Recognize and reward team members for their contributions and achievements. This helps maintain motivation and encourages continued effort. Acknowledge milestones and celebrate successes.
- Flexibility and Support: Provide flexibility and support to address team needs and challenges. Adjust OKRs as needed based on evolving circumstances and team performance. Offer opportunities for skill development and professional growth.
Structuring Content with Tables
Tables are crucial for presenting data in a clear, concise, and easily digestible format when discussing analytics OKRs. They allow for comparison, highlighting trends, and providing a structured overview of key metrics and responsibilities. Using tables enhances comprehension and makes complex information more accessible.
Key Metrics Related to Analytics OKRs
Tables effectively organize key metrics, enabling quick identification of performance against objectives. This structured approach allows for a comprehensive understanding of the progress toward OKRs.
| Metric | Description | Target | Current Value | Status |
|---|---|---|---|---|
| Customer Churn Rate | Percentage of customers who discontinue service in a given period. | 5% | 4.8% | On Track |
| Website Conversion Rate | Percentage of website visitors who complete a desired action (e.g., purchase). | 10% | 9.5% | Exceeding Target |
| Average Session Duration | Average time spent by users on the platform. | 15 minutes | 18 minutes | Excellent |
Comparing OKR Implementation Approaches
A table can effectively illustrate different approaches to OKR implementation for analytics teams, aiding in informed decision-making.
| Approach | Focus | Strengths | Weaknesses |
|---|---|---|---|
| Data-Driven Approach | Utilizing data analysis to drive OKR setting and tracking. | Increased accuracy, objective measurements, and demonstrable impact. | Potential for delayed feedback loops, requiring more sophisticated analytics infrastructure. |
| Collaborative Approach | Engaging multiple stakeholders in the OKR process. | Increased buy-in, diverse perspectives, and improved alignment. | Potential for slower decision-making, necessitating clear communication channels. |
| Agile Approach | Adapting OKRs based on real-time data and feedback. | Increased flexibility, responsiveness, and ability to pivot quickly. | Potential for lack of long-term vision, requiring strong project management skills. |
Responsibilities of Analytics Team Roles Concerning OKRs
Clearly defining roles and responsibilities concerning OKRs ensures accountability and smooth execution. A table can clearly illustrate the division of labor within the team.
| Role | Primary Responsibility | Specific Tasks |
|---|---|---|
| Data Analyst | Collecting, cleaning, and analyzing data. | Data extraction, data validation, reporting. |
| Analytics Manager | Overseeing OKR implementation and progress. | Stakeholder communication, resource allocation, performance reviews. |
| Business Analyst | Connecting analytics insights to business objectives. | Identifying opportunities, translating data into actionable insights. |
Relationship Between Business Objectives and Analytics Team OKRs
Establishing a direct link between business objectives and analytics team OKRs is vital for strategic alignment.
| Business Objective | Analytics Team OKR | Metrics |
|---|---|---|
| Increase customer lifetime value | Improve customer retention by 15% | Customer churn rate, average purchase value, customer engagement. |
| Enhance product adoption | Increase user engagement by 20% | App usage, feature usage, user onboarding rate. |
Illustrative Examples

Defining and implementing Objectives and Key Results (OKRs) for analytics teams requires practical examples to illustrate their successful application. This section provides real-world scenarios and examples to demonstrate how OKRs can translate business objectives into tangible, measurable achievements for your analytics team. We will explore how data-driven insights can significantly improve business performance, and illustrate different OKR structures for diverse analytics needs.
Hypothetical Success Story
A marketing analytics team at a retail company set an ambitious OKR to increase customer lifetime value (CLTV) by 15% within the next quarter. Their key results included increasing the average order value by 10%, improving customer retention rates by 5%, and identifying and targeting high-value customer segments. Through analyzing purchase patterns and customer demographics, the team identified a specific segment with high potential for increased spending.
By implementing targeted marketing campaigns, they successfully increased average order value and customer retention rates. The results exceeded expectations, with CLTV increasing by 20% – demonstrating the positive impact of a well-defined and executed analytics OKR strategy.
Translating Business Objectives into Analytics OKRs
Consider a business objective to improve conversion rates on an e-commerce website. To translate this into actionable analytics OKRs, the team could define the following:
- Objective: Increase conversion rates on the e-commerce website.
- Key Result 1: Reduce cart abandonment rate by 10% within the next quarter. This requires analyzing checkout flow and user behavior during the purchase process. Specific strategies could include simplifying the checkout process, improving website loading speed, and implementing a live chat feature.
- Key Result 2: Increase average order value (AOV) by 5%. This necessitates identifying product recommendations and upselling opportunities, as well as analyzing customer purchase history and browsing behavior to tailor product suggestions.
- Key Result 3: Increase the number of new customers who complete a purchase by 15% through targeted marketing campaigns. This could be measured by the number of new customers who complete a purchase within 30 days of first visiting the website.
These OKRs provide a clear framework for the analytics team to focus their efforts and track progress towards the business objective.
Data-Driven Insights and Business Performance Improvement
A company experienced a significant drop in sales during the holiday season. The analytics team, using data visualization tools and predictive modeling, discovered that a particular product category was underperforming due to a pricing issue. Through analysis, the team determined that competitors were offering similar products at lower prices. This led to a strategic decision to adjust pricing for the underperforming category, which resulted in a significant sales increase and exceeded projections by 15%.
This case study illustrates how data-driven insights can lead to proactive decision-making and improve overall business performance.
Different OKR Structures for Analytics Needs
The structure of OKRs for an analytics team can vary based on the specific needs and focus areas. Examples include:
| OKR Structure | Focus Area | Example |
|---|---|---|
| Data Quality & Accuracy | Ensuring data integrity and reliability | Increase the accuracy of sales data by 15% through implementing data validation checks and automating data cleansing procedures. |
| Data Visualization & Reporting | Improving data accessibility and understanding | Develop and implement 5 new interactive dashboards to visualize key performance indicators (KPIs) for business teams. |
| Predictive Analytics | Using data to forecast future trends | Improve the accuracy of sales forecasting models by 10% by incorporating external economic indicators and using machine learning algorithms. |
These structures provide a starting point for designing effective OKRs tailored to different analytics team priorities.
Wrap-Up: Okr For Analytics Team
In conclusion, effectively implementing OKRs for your analytics team requires a structured approach, focusing on clear communication, motivation, and continuous improvement. By aligning analytics efforts with business strategy, you can unlock valuable insights and drive significant business impact. This guide offers a practical roadmap for success.