
Balance sheet vs income statement: Understanding these fundamental financial reports is crucial for anyone looking to analyze a company’s health. The balance sheet provides a snapshot of a company’s assets, liabilities, and equity at a specific point in time, while the income statement tracks a company’s financial performance over a period. This in-depth look will explore the key differences, structures, and relationships between these vital financial statements, highlighting their importance in evaluating a company’s financial position and profitability.
This exploration will cover everything from defining each statement to analyzing their interrelationships. We’ll delve into the specifics of assets, liabilities, equity, revenue, expenses, and net income, illustrating how these components contribute to the overall picture of a company’s financial health. The discussion will include real-world examples and case studies, making the concepts more tangible and practical.
Introduction to Financial Statements

Financial statements are the lifeblood of any business, providing a snapshot of its financial health and performance. They are crucial tools for investors, creditors, and management alike, offering insights into profitability, liquidity, and overall financial well-being. Understanding these statements is paramount for making informed decisions and navigating the complexities of the business world. This section will delve into the core concepts of balance sheets and income statements, examining their individual roles and their interrelationship.
Balance Sheets and Income Statements: Fundamental Definitions
Balance sheets and income statements are two fundamental financial statements. A balance sheet provides a snapshot of a company’s financial position at a specific point in time. It details the company’s assets, liabilities, and equity. The income statement, on the other hand, summarizes a company’s financial performance over a period of time, typically a quarter or a year.
It highlights revenues, expenses, and net income or loss. The interplay between these statements is critical to understanding a company’s overall financial health.
Purpose of Each Statement in Financial Reporting
The balance sheet’s purpose is to present a static picture of a company’s financial position. It answers the question: What does the company own, what does it owe, and what is the difference between the two? The income statement’s purpose is to demonstrate a company’s financial performance over a period. It tracks the revenues earned and expenses incurred to determine profitability.
Together, they paint a comprehensive picture of a company’s financial situation.
Relationship Between Balance Sheets and Income Statements
The relationship between the two statements is crucial. Net income from the income statement directly impacts the balance sheet. Revenues and expenses on the income statement ultimately affect the balance sheet’s asset and liability components. For example, revenue increases assets (cash, accounts receivable), while expenses decrease assets or increase liabilities. This interconnectedness is essential for accurate financial reporting.
Examples of Business Applications
Consider a retail clothing store. Its balance sheet would show the value of inventory, the amount of cash on hand, and outstanding debts. The income statement would detail sales, costs of goods sold, and operating expenses, revealing the store’s profitability. For a software company, the balance sheet would reflect the value of intellectual property (software licenses) and accounts receivable, while the income statement would display revenue from software sales and related expenses.
The same principles apply across various industries, from manufacturing to services.
Comparison of Balance Sheet and Income Statement Components
| Component | Balance Sheet | Income Statement |
|---|---|---|
| Assets | Resources owned by the company (e.g., cash, accounts receivable, property, plant, and equipment) | Not a direct component, but revenue and expenses impact assets and liabilities |
| Liabilities | Obligations of the company to others (e.g., accounts payable, loans payable) | Not a direct component, but revenue and expenses impact assets and liabilities |
| Equity | The residual interest in the assets of the entity after deducting all its liabilities | Not a direct component, but revenue and expenses impact equity |
| Revenue | Not a direct component | Income generated from the sale of goods or services |
| Expenses | Not a direct component | Costs incurred in generating revenue |
| Net Income/Loss | Not a direct component | Difference between revenue and expenses |
Balance Sheet: Balance Sheet Vs Income Statement

The balance sheet is a financial statement that provides a snapshot of a company’s assets, liabilities, and equity at a specific point in time. It’s a crucial tool for understanding a company’s financial position and its ability to meet its obligations. It’s built upon the fundamental accounting equation, which forms the bedrock of its structure and interpretation.The balance sheet is a cornerstone of financial analysis, offering insights into a company’s financial health and stability.
Understanding its components and the relationships between them is vital for investors, creditors, and management alike.
The Accounting Equation
The accounting equation, Assets = Liabilities + Equity, is the foundation of the balance sheet. It highlights the fundamental relationship between what a company owns (assets), what it owes (liabilities), and the residual ownership interest (equity). This equation must always balance, reflecting the underlying financial structure of the entity. It ensures that the total value of a company’s assets is equal to the sum of its liabilities and equity.
Structure of Assets, Liabilities, and Equity
Assets represent what a company owns, including cash, accounts receivable, property, plant, and equipment (PP&E), and inventory. Liabilities represent what a company owes to others, such as accounts payable, salaries payable, and loans. Equity represents the residual interest in the assets after deducting liabilities.
Assets
Assets are further categorized into current and non-current assets. Current assets are those expected to be converted into cash or used up within one year. Examples include cash, accounts receivable, inventory, and prepaid expenses. Non-current assets are those expected to provide benefits for more than one year. Examples include property, plant, and equipment (PP&E), such as buildings, machinery, and vehicles, and long-term investments.
Liabilities
Liabilities are also categorized into current and non-current liabilities. Current liabilities are those obligations that are expected to be settled within one year. Examples include accounts payable, salaries payable, and short-term loans. Non-current liabilities are obligations that are due in more than one year. Examples include long-term loans, mortgages, and deferred revenue.
Equity
Equity represents the residual interest in the assets after deducting liabilities. It reflects the ownership stake of the company’s shareholders. Common examples include common stock, retained earnings, and treasury stock.
Working Capital
Working capital is a crucial measure of a company’s short-term liquidity. It’s calculated as current assets minus current liabilities. A positive working capital indicates that the company has sufficient liquid assets to meet its short-term obligations. A negative working capital suggests potential liquidity problems.
Typical Balance Sheet Format
| Assets | Liabilities & Equity |
|---|---|
| Current Assets | Current Liabilities |
| Cash | Accounts Payable |
| Accounts Receivable | Salaries Payable |
| Inventory | Short-term Loans |
| Prepaid Expenses | |
| Non-Current Assets | Long-Term Liabilities |
| Property, Plant & Equipment (PP&E) | Long-term Loans |
| Investments | |
| Equity | |
| Common Stock | |
| Retained Earnings |
This table illustrates a typical balance sheet format, demonstrating the structure of assets, liabilities, and equity. Note that specific accounts may vary depending on the company’s operations and industry.
Income Statement
The income statement, also known as the profit and loss statement, is a financial report that summarizes a company’s financial performance over a specific period, typically a quarter or a year. It details the revenue generated, the costs incurred, and the resulting profit or loss. Understanding the income statement is crucial for investors, creditors, and management to assess a company’s profitability and operational efficiency.
Structure of the Income Statement, Balance sheet vs income statement
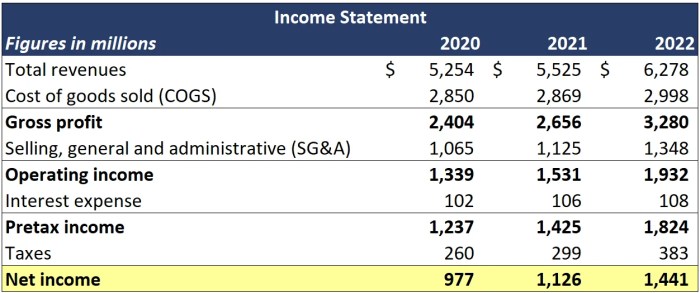
The income statement follows a structured format, presenting key components in a logical order. It begins with revenue, which represents the total amount of money a company earns from its sales. This is followed by the cost of goods sold (COGS), which is the direct cost associated with producing those goods or services. Subtracting COGS from revenue yields the gross profit.
Operating expenses, such as salaries, rent, and utilities, are then deducted to arrive at operating income. Non-operating income and expenses, such as interest income or losses, are further considered. Finally, taxes are deducted to arrive at the net income, which represents the company’s profit after all expenses are considered.
Revenue and Cost of Goods Sold
Revenue is the top-line figure on the income statement, representing the total amount of money a company earned from sales during the period. Cost of Goods Sold (COGS) represents the direct costs of producing the goods or services sold. This includes raw materials, direct labor, and manufacturing overhead directly tied to production.
Expenses
Expenses are the costs incurred in running the business. They are categorized into operating and non-operating expenses.
- Operating Expenses: These are costs directly related to the day-to-day operations of the business. Examples include salaries, rent, utilities, marketing, and administrative expenses. They are crucial for understanding a company’s operational efficiency.
- Non-Operating Expenses: These are expenses that are not directly related to the core operations of the business. Examples include interest expense, losses from the sale of assets, and unusual items. These expenses can provide insight into the company’s overall financial health and risk profile.
Profitability Ratios
Profitability ratios measure a company’s ability to generate profits relative to its revenue or assets. These ratios provide valuable insights into a company’s financial performance. A few examples are:
- Gross Profit Margin: This ratio shows the percentage of revenue remaining after deducting the cost of goods sold. A higher gross profit margin generally indicates better profitability.
Gross Profit Margin = (Revenue – Cost of Goods Sold) / Revenue
- Net Profit Margin: This ratio shows the percentage of revenue remaining after all expenses, including taxes, have been deducted. It is a crucial measure of overall profitability.
Net Profit Margin = Net Income / Revenue
Typical Income Statement Format
| Item | Amount |
|---|---|
| Revenue | |
| Cost of Goods Sold | |
| Gross Profit | |
| Operating Expenses | |
| Operating Income | |
| Non-Operating Income/Expenses | |
| Interest Expense | |
| Income Before Taxes | |
| Income Tax Expense | |
| Net Income |
Example Income Statement
| Item | Amount (USD) |
|---|---|
| Revenue | 1,000,000 |
| Cost of Goods Sold | 600,000 |
| Gross Profit | 400,000 |
| Operating Expenses | 200,000 |
| Operating Income | 200,000 |
| Interest Expense | 10,000 |
| Income Before Taxes | 190,000 |
| Income Tax Expense | 60,000 |
| Net Income | 130,000 |
Comparing Balance Sheets and Income Statements
Understanding the balance sheet and income statement is crucial for evaluating a company’s financial health. These two key financial reports offer different perspectives on a company’s performance. While the income statement reveals a company’s profitability over a period of time, the balance sheet provides a snapshot of its financial position at a specific point in time. Recognizing their distinct purposes and the interrelationships between them is essential for a comprehensive understanding of a business.
Understanding the balance sheet versus the income statement is crucial for any business owner. It’s like having two sides of the same coin, one showing your assets and liabilities, the other your revenues and expenses. This is where the concept of “the scourge of the social interlopers” the scourge of the social interlopers becomes interesting, as those who disrupt productivity in the workplace are impacting the very numbers that define your financial health.
Ultimately, both statements are vital for making sound financial decisions and staying on top of your business’s performance.
Timing of Information
The balance sheet provides a static picture of a company’s assets, liabilities, and equity at a particular moment. It reflects the financial position as of a specific date, often the end of a quarter or year. The income statement, conversely, reports on a company’s performance over a defined period, such as a month, quarter, or year. It summarizes revenues and expenses during that period.
This difference in timing is fundamental to understanding how these statements work together to provide a holistic view of a company’s financial health.
Key Differences in Information
The balance sheet details a company’s assets, liabilities, and equity. Assets represent what the company owns, liabilities represent what the company owes, and equity represents the owners’ stake in the company. The income statement, on the other hand, focuses on the revenues and expenses generated during a specific period. It tracks the flow of money into and out of the company.
Interrelationship of Balance Sheet and Income Statement Items
The relationship between the two statements is vital. Net income from the income statement directly impacts the balance sheet’s equity section. Increased net income typically results in a higher retained earnings balance, a component of equity. Conversely, losses reduce retained earnings. Also, certain income statement items, like depreciation expense, can affect the balance sheet’s asset value.
Depreciation reflects the reduction in the value of assets over time.
Use in Evaluating Financial Health
Both statements are critical tools in evaluating a company’s financial health. The balance sheet provides insight into a company’s solvency, its ability to meet its short-term and long-term obligations. The income statement reveals profitability, demonstrating the company’s ability to generate revenue and manage expenses. Analyzing both statements together offers a more comprehensive picture of a company’s overall financial health and future prospects.
For example, high debt levels on the balance sheet, coupled with declining profits on the income statement, could signal potential financial distress.
Comparison Table
| Feature | Balance Sheet | Income Statement |
|---|---|---|
| Focus | Snapshot of financial position at a specific point in time. | Performance over a period of time. |
| Key Elements | Assets, Liabilities, Equity | Revenues, Expenses, Net Income |
| Timing | As of a specific date. | For a specific period (e.g., a quarter or year). |
| Purpose | Shows the company’s financial position. | Shows the company’s profitability. |
Analyzing Relationships Between Statements
Financial statements, like the balance sheet and income statement, aren’t isolated documents. They’re interconnected pieces of a company’s financial puzzle. Understanding these relationships is crucial for a deeper insight into a company’s financial health and performance. Analyzing how these statements interact helps to spot trends, identify potential problems, and assess the overall financial situation more effectively.Understanding how retained earnings, assets, liabilities, and net income flow between the balance sheet and income statement provides a comprehensive view of a company’s financial position and performance.
This deeper understanding unlocks insights into the company’s profitability, efficiency, and overall financial health.
Understanding the balance sheet versus the income statement is crucial for any business owner, but what about the balance sheet and income statement of the entire nation’s cybersecurity? A new military command to guard US cybersystems, new military command to guard us cybersystems , highlights the need for robust national security measures. Ultimately, a healthy digital infrastructure, like a strong financial statement, is key to long-term stability and resilience.
Retained Earnings Connection
Retained earnings are a key link between the balance sheet and income statement. Retained earnings on the balance sheet represent accumulated profits that haven’t been distributed as dividends. The income statement’s net income directly impacts retained earnings. Net income is added to retained earnings, while net losses reduce retained earnings. This connection illustrates how profitability directly affects the accumulated capital of the company.
Impact of Asset and Liability Changes on the Income Statement
Changes in assets and liabilities often reflect business activities and decisions that are recorded in the income statement. For instance, increased inventory levels might signal expansion plans, impacting sales and costs. Similarly, changes in accounts receivable, representing outstanding customer payments, can influence revenue recognition and collection patterns. The income statement captures the financial effects of these changes.
Net Income’s Effect on the Balance Sheet
Net income directly affects the balance sheet through retained earnings. As mentioned earlier, net income increases retained earnings, leading to an increase in equity. Conversely, net losses decrease retained earnings, reducing equity. This connection highlights the vital role of profitability in building a company’s equity and financial stability.
Analyzing Trends in Both Statements
Analyzing trends in both statements over time reveals crucial insights into a company’s performance. For example, consistent growth in net income coupled with rising assets suggests that the company is effectively utilizing resources to generate profits. Conversely, a declining trend in both net income and assets might signal potential financial distress. Comparing the balance sheet and income statement over several periods allows for identifying significant patterns and potential areas of concern.
Calculating Key Ratios Combining Both Statements
Several ratios combine data from both statements to offer a deeper understanding of a company’s financial health. One key ratio is the return on equity (ROE), which measures how efficiently a company uses shareholder equity to generate profit. ROE is calculated by dividing net income by shareholder’s equity.
ROE = Net Income / Shareholder’s Equity
Another critical ratio is the asset turnover ratio, which assesses how effectively a company uses its assets to generate revenue. This ratio is calculated by dividing net sales by average total assets.
Asset Turnover = Net Sales / Average Total Assets
Analyzing these and other ratios, like the debt-to-equity ratio, helps to assess the company’s financial health and potential risks more thoroughly. These ratios provide a quantitative perspective on the interconnectedness of the balance sheet and income statement.
Real-World Examples and Case Studies
Putting financial statements into practice is key to understanding a company’s health and potential. This section dives into real-world applications, demonstrating how balance sheets and income statements are used to analyze companies and make informed investment decisions. We’ll explore examples across different industries, highlighting the importance of these statements in evaluating performance.
Case Study: Hypothetical Tech Startup
Consider “InnovateTech,” a hypothetical tech startup focused on developing innovative software solutions. Their balance sheet and income statement for the year 2024 reveal insights into their financial position and operational efficiency.
InnovateTech 2024 Balance Sheet Highlights:
- High levels of accounts receivable suggest potential credit risk.
- A significant portion of assets is tied up in inventory, hinting at production capacity or potential obsolescence.
- A considerable amount of long-term debt indicates financial leverage.
InnovateTech 2024 Income Statement Highlights:
- Strong revenue growth suggests market demand.
- High research and development expenses may reflect future growth potential but impact current profitability.
- Net income shows a positive trend.
Investment Decisions
Financial statements provide crucial information for investors. Analyzing trends in revenue, expenses, assets, and liabilities allows for better risk assessment and potential returns.
Understanding the balance sheet versus the income statement is crucial for any business owner. It’s like figuring out your finances – one shows your current assets and liabilities, while the other tracks your revenue and expenses over a period. Speaking of financial insights, the new Archos Gen10 XS tablet line has finally arrived, bringing a fresh perspective to the tablet market.
This new tablet line is a game-changer for portable productivity, making it easier than ever to visualize your financial data and gain valuable insights. Ultimately, both financial statements are vital for assessing a company’s health and making sound business decisions.
- Investors can assess a company’s financial strength, liquidity, and solvency through balance sheet analysis.
- The income statement helps gauge a company’s profitability and operational efficiency.
- Combining both statements provides a comprehensive view of a company’s financial health, aiding in investment decisions.
Industry Applications
The usefulness of balance sheets and income statements varies across industries. For example, a retail company will focus on inventory turnover and sales, while a manufacturing company will emphasize production costs and efficiency.
- Retail: Assessing inventory levels, sales trends, and customer payment patterns are crucial for retail companies.
- Technology: High R&D expenses and intellectual property valuation are key factors in the tech industry.
- Manufacturing: Production costs, efficiency, and raw material costs are important metrics.
Financial Ratio Comparison
This table compares key financial ratios derived from InnovateTech’s 2024 balance sheet and income statement. These ratios offer insights into profitability, liquidity, and solvency.
| Ratio | Formula | Balance Sheet-Derived | Income Statement-Derived |
|---|---|---|---|
| Current Ratio | Current Assets / Current Liabilities | 2.5 | N/A |
| Debt-to-Equity Ratio | Total Debt / Total Equity | 0.8 | N/A |
| Gross Profit Margin | (Revenue – Cost of Goods Sold) / Revenue | N/A | 35% |
| Net Profit Margin | Net Income / Revenue | N/A | 10% |
Key Concepts and Terminology
Understanding the language of financial statements is crucial for interpreting their information effectively. This section delves into the core terms and concepts used in balance sheets and income statements, providing definitions and examples to clarify their meaning. A strong grasp of these fundamental terms will greatly enhance your ability to analyze financial data and make informed decisions.
Crucial Financial Statement Terms
This section defines fundamental terms used in financial statements, enabling a clearer comprehension of balance sheets and income statements. These terms are frequently encountered in financial reporting and analysis.
Current Assets represent resources a company expects to convert to cash or use within one year or the operating cycle, whichever is longer. Examples include cash, accounts receivable, and short-term investments. Understanding current assets helps assess a company’s short-term liquidity and ability to meet immediate obligations.
Accounts Payable are short-term obligations owed by a company to its suppliers for goods or services received on credit. They represent a company’s short-term liabilities. Analysis of accounts payable helps understand a company’s payment practices and its relationship with suppliers.
Cost of Goods Sold (COGS) represents the direct costs attributable to the production of goods sold by a company. This includes raw materials, direct labor, and manufacturing overhead. COGS is a critical component of the income statement, directly impacting the gross profit.
Net Income is the final profit a company earns after deducting all expenses from its revenues. It reflects the company’s overall profitability for a given period. Net income is a key indicator of a company’s financial performance and is often used in evaluating investment opportunities.
Glossary of Key Terms
Current Assets: Resources expected to be converted to cash or used within one year or the operating cycle.
Accounts Payable: Short-term obligations owed to suppliers for goods or services received on credit.
Cost of Goods Sold (COGS): Direct costs associated with producing goods sold by a company.
Net Income: Profit after deducting all expenses from revenues.
Key Abbreviations and Their Meanings
Understanding abbreviations used in financial statements streamlines comprehension. This list presents common abbreviations and their definitions.
- COGS: Cost of Goods Sold
- A/R: Accounts Receivable
- A/P: Accounts Payable
- EPS: Earnings Per Share
- FIFO: First-In, First-Out (inventory valuation method)
- LIFO: Last-In, First-Out (inventory valuation method)
Wrap-Up
In conclusion, mastering the balance sheet and income statement is essential for comprehending a company’s financial standing. By understanding the structure, components, and relationships between these two statements, investors, analysts, and business owners gain valuable insights into a company’s performance and potential. This knowledge empowers informed decision-making, whether it’s evaluating potential investments or strategizing for business growth. Remember to always analyze trends and ratios to fully understand the implications of the data presented.