
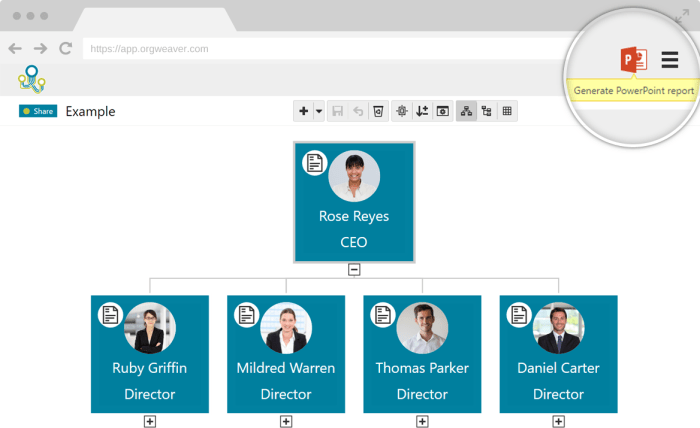
Best org chart software empowers teams with a visual roadmap for success. From hierarchical structures to dynamic matrix models, these tools clarify roles, responsibilities, and communication pathways. This comprehensive exploration dives deep into the features, pricing, and user experience of top-tier org chart software, helping you choose the perfect solution for your team’s needs.
This guide examines the core functionalities of organizational chart software, ranging from simple hierarchical charts to complex matrix structures. We’ll cover the crucial features that streamline team communication and collaboration, along with advanced functionalities like real-time updates and data integration. Understanding the various pricing models and integration capabilities is key to selecting the optimal software. Different industries and team structures have varying needs, so choosing the right software is crucial to maximizing efficiency and productivity.
Introduction to Organizational Chart Software
Organizational chart software is a powerful tool for visualizing and managing the hierarchical structure of an organization. It provides a clear and concise representation of reporting relationships, responsibilities, and team structures. This allows for better communication, collaboration, and overall efficiency within a company. From small startups to large corporations, understanding team dynamics is crucial for success, and these tools facilitate this understanding.These tools offer more than just a static picture; they enable dynamic adjustments to reflect organizational changes and facilitate workflow management.
Modern software solutions also offer features to help analyze data, track performance, and optimize team effectiveness, making them valuable assets in any organization.
Different Types of Organizational Charts
Understanding the various types of organizational charts is key to selecting the right software for specific needs. Different chart types cater to different organizational structures and communication strategies.
- Hierarchical Charts: These charts depict a traditional top-down structure, with reporting lines clearly defined from senior management to individual employees. This structure is common in organizations with a strong chain of command and well-defined roles. For example, a manufacturing company with a president, vice presidents, and departmental managers would likely use a hierarchical chart to illustrate their structure.
Finding the best org chart software can be tricky, but it’s crucial for visualizing your company structure. Ultimately, understanding your company’s organizational flow helps you align your goals with career opportunities. For example, if you’re aiming for a specific role, you need to assess where that fits within the organizational chart. Knowing how to navigate your company’s structure is key, and this will directly influence your career path.
A well-designed org chart can help you see where you can best contribute and even reveal potential career advancement paths, making sure your ambitions are aligned with the needs of the company. This kind of insight is essential, and it is often directly correlated with the use of effective org chart software like the ones found on dreams and demand aligning goals with career opportunities.
The best org chart software will not only illustrate your company’s hierarchy but will also allow for flexibility and growth.
- Matrix Charts: These charts represent a more complex structure where employees report to multiple managers or teams. This model is often seen in project-based environments or organizations with cross-functional teams. A software company developing a new product might use a matrix chart to show how engineers, designers, and marketers collaborate on different aspects of the project.
- Flat Charts: These charts minimize hierarchical levels, emphasizing a more collaborative and decentralized structure. They are often found in organizations that prioritize teamwork and employee empowerment. A consulting firm with a flat structure would show a minimal number of layers between senior consultants and junior staff, encouraging direct communication and shared responsibility.
Key Functionalities of Organizational Chart Software
Effective organizational chart software goes beyond simply displaying structure. Key functionalities support various organizational needs.
- Visualization: The software provides clear visual representations of the organizational structure, facilitating quick understanding of roles and reporting lines.
- Data Management: The software allows for storing and managing employee information, such as contact details, job titles, and departments.
- Collaboration Tools: Integration with communication platforms (email, chat) allows teams to collaborate efficiently.
- Flexibility: The software allows for easy updates to reflect changes in the organizational structure. This is crucial for adapting to evolving business needs.
Importance of Organizational Charts in Business
Organizational charts are not merely decorative; they serve crucial business functions. They provide a clear picture of roles and responsibilities, facilitating effective communication and collaboration.
- Improved Communication: They clarify who reports to whom, promoting clear communication channels.
- Enhanced Collaboration: They highlight cross-functional relationships, supporting better teamwork.
- Streamlined Processes: They visualize workflows and processes, aiding in identification of bottlenecks and improvements.
- Decision Making: They provide a clear overview of decision-making hierarchies, improving efficiency.
Comparison of Organizational Chart Types
| Chart Type | Description | Key Features | Use Cases |
|---|---|---|---|
| Hierarchical | Traditional top-down structure | Clear reporting lines, defined roles | Large companies, established industries |
| Matrix | Complex structure with multiple reporting lines | Cross-functional teams, project-based work | Software development, consulting firms |
| Flat | Minimal hierarchical levels | Empowered employees, decentralized decision-making | Startups, agile organizations |
Features and Capabilities
Organizational chart software goes beyond a simple visual representation of a company’s structure. Modern tools offer a suite of features that significantly impact team communication, collaboration, and overall workflow efficiency. These features empower organizations to navigate complex hierarchies and foster seamless interactions among employees.Effective organizational chart software should facilitate clear lines of communication, ensuring that information flows smoothly from top to bottom and across different departments.
This, in turn, strengthens the overall team dynamics. By providing an easily digestible view of the entire structure, these tools help identify potential bottlenecks or communication gaps within the organization.
Essential Features for Effective Chart Creation
A robust organizational chart software should provide fundamental tools for creating and managing charts. These tools include intuitive drag-and-drop functionalities, various formatting options, and options for specifying reporting structures. The software should allow for easy updates and modifications as the organizational structure evolves. These fundamental capabilities enable quick adjustments to reflect changes in roles, responsibilities, or reporting relationships.
Finding the best org chart software can be tricky, but it’s crucial for clear communication and workflow in any team. A well-structured org chart streamlines processes, and for new managers, understanding team dynamics is key. That’s why checking out the new manager gift guide is a great place to start thinking about the tools that support a successful team.
Ultimately, the right org chart software can make a huge difference in a manager’s ability to lead effectively.
Improving Team Communication and Collaboration
Organizational charts are more than just static diagrams; they can be dynamic tools for fostering collaboration. Features like real-time updates enable all stakeholders to view the latest organizational structure immediately, ensuring everyone is aligned with the current reporting relationships. This real-time visibility significantly reduces confusion and fosters a shared understanding of roles and responsibilities.Visual representation is crucial in facilitating communication.
Clear visual representations of team structures help clarify communication channels. This clear communication structure reduces ambiguity and minimizes misunderstandings. Well-defined reporting structures are essential for effective communication and decision-making.
Advanced Functionalities
Advanced features further enhance the value of organizational chart software. Customizable templates allow users to tailor the chart to their specific needs and branding. This tailored approach ensures the chart effectively communicates the company’s unique structure.Real-time updates ensure everyone in the organization has access to the latest information. This crucial feature keeps the chart current and prevents outdated information from impacting decision-making.Data integration is a powerful feature, connecting the organizational chart to other crucial business systems.
This integration ensures that data across different systems remains consistent. For example, connecting with project management software allows for quick identification of team members assigned to projects, enhancing team coordination.
Impact on Workflow Efficiency and Decision-Making
By providing a clear overview of the organizational structure, these tools enhance workflow efficiency. A well-designed chart facilitates the identification of potential bottlenecks or inefficiencies in workflows. This visualization helps leaders quickly spot areas where communication breakdowns or process improvements are needed.Clear visualizations also contribute to more informed decision-making. By visualizing the reporting lines and team compositions, managers can easily identify individuals with the necessary expertise for particular projects or decisions.
This informed decision-making capability directly contributes to the effectiveness of the organization.
Types of Integrations
Integrating organizational charts with other business systems significantly enhances their utility. This integration streamlines workflows and provides a comprehensive view of the organization’s activities.
| Integration Type | Description | Benefits | Example Software |
|---|---|---|---|
| Project Management | Connects organizational charts with project management tools to map team members to projects. | Improved project allocation, resource management, and visibility into project-related tasks. | Asana, Trello, Jira |
| CRM | Links organizational structure with customer relationship management systems to identify key contacts within the organization. | Streamlined customer interactions, improved sales processes, and better knowledge sharing across departments. | Salesforce, HubSpot |
| Communication Tools | Integrates with communication platforms to facilitate seamless internal communication. | Enhanced team collaboration, improved information sharing, and reduced communication silos. | Slack, Microsoft Teams |
User Experience and Interface
Creating an organizational chart shouldn’t feel like a chore. A good org chart software prioritizes a user-friendly interface that makes the process intuitive and enjoyable, regardless of the user’s technical expertise. This ease of use is crucial for adoption across different roles within an organization, from executives to junior employees. A well-designed interface encourages engagement and ultimately helps the organization make the most of the tool.A robust interface facilitates seamless chart creation and modification, allowing for quick updates and adjustments as roles and responsibilities evolve.
Intuitive design elements streamline the process, making it a valuable asset for both small teams and large corporations. Effective user interfaces not only make the process efficient but also improve the overall user experience.
User-Friendly Interfaces for Intuitive Chart Creation
A well-designed interface significantly impacts the ease with which users create and manage organizational charts. Key elements include clear visual cues, logical navigation, and intuitive controls. These elements work together to minimize the learning curve and maximize user engagement.
Different Interface Designs and Their Impact
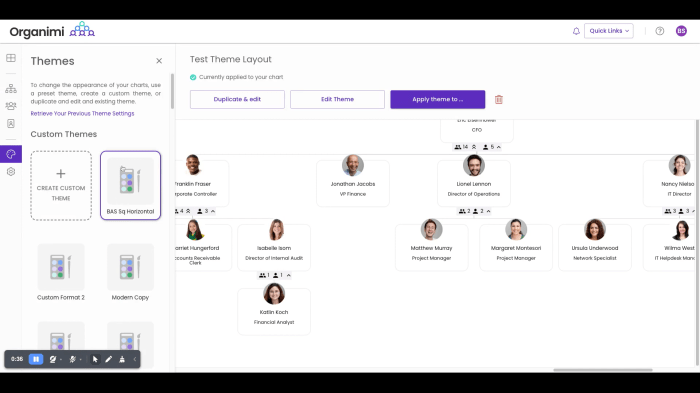
The choice of interface design greatly influences user engagement and adoption. Drag-and-drop interfaces, for example, offer a highly visual and intuitive way to arrange employees, fostering a sense of control and flexibility. Pre-built templates provide structure and a head start, accelerating the process for users familiar with a specific organizational layout. Each design choice has the potential to improve or hinder the user experience.
Ease of Use and Navigation for Various User Roles
The importance of ease of use and navigation extends across all user roles. Executives need a quick way to visualize the entire organizational structure, while team leads might focus on specific departments or reporting lines. A user-friendly interface should cater to the specific needs of each role, providing tailored views and navigation options. An efficient interface empowers all users, regardless of their technical expertise.
Comparison of Interface Designs: Drag-and-Drop vs. Pre-built Templates
Different interface designs cater to different needs and preferences. Drag-and-drop interfaces provide maximum flexibility and customization, allowing users to arrange employees and departments precisely. Pre-built templates offer structure and speed, ideal for organizations with a standard hierarchical structure. The choice between these two depends on the organization’s specific needs and existing structure.
Finding the best org chart software can be tricky, but it’s crucial for visualizing your company structure. Recently, I’ve been really impressed by the employee dedication at HP, exemplified by the incredible turnaround story the employee heroes at hp making an impossible turnaround. It’s inspiring to see how clear organizational structures can empower teams, which is why I’m now exploring more options for effective org chart software.
Ultimately, the right tool can significantly improve communication and collaboration within any organization.
Creating a Simple Organizational Chart Using a Drag-and-Drop Interface
A drag-and-drop interface provides a visual representation of the organization’s structure. This is a highly intuitive method for constructing the chart.
- Step 1: Identify the top-level executives and place them at the top of the chart.
- Step 2: Drag subordinate employees to the appropriate level below their manager.
- Step 3: Continue this process until all employees are appropriately placed within the hierarchy.
- Step 4: Adjust positions and reporting lines as needed.
- Step 5: Add further details like job titles or contact information.
This process, while straightforward, illustrates the power of a well-designed drag-and-drop interface in creating an organizational chart. Visual representation makes the process remarkably simple and effective.
Pricing and Plans
Choosing the right organizational chart software often hinges on budget and specific needs. Different pricing models cater to various team sizes and feature requirements. Understanding the nuances of each plan is crucial for making an informed decision. Different tiers typically offer varying levels of features, impacting functionality and user experience.Pricing models for organizational chart software are diverse, often employing subscription-based models with varying tiers.
Some offer a free trial, while others have a freemium option, allowing users to experience the software before committing to a paid plan. These models are designed to provide flexibility and accessibility, accommodating diverse organizational budgets and needs.
Pricing Models Overview
Various pricing models are employed by organizational chart software providers. Commonly, they use subscription models with tiers ranging from basic plans for small teams to premium options for large enterprises. These tiers usually include a progressively increasing set of features and functionalities.
Comparison of Pricing Tiers
The following table provides a comparative overview of pricing tiers for different organizational chart software. Note that specific features and included functionalities may vary across providers and software versions.
| Software | Tier 1 | Tier 2 | Tier 3 |
|---|---|---|---|
| Software A | Basic organizational chart creation; limited user access; basic reporting; no collaboration tools; 5 users. | Enhanced features including team collaboration tools, real-time updates, basic dashboards, and advanced reporting options; 10 users. | Unlimited users, advanced analytics, custom visualizations, API integrations, and enterprise-grade security; 25+ users. |
| Software B | Limited chart types; single user access; no team collaboration; basic data storage; 1 user. | Multiple user access; basic collaboration tools; limited reporting options; 5 users. | Unlimited users; advanced collaboration tools; customizable dashboards; comprehensive reporting and analytics; advanced integrations. |
| Software C | Simple organizational chart creation; limited storage; basic reporting; 2 users. | Enhanced chart types; team collaboration features; basic data visualization; 10 users. | Unlimited users; advanced analytics; custom branding options; enterprise-level security and support; comprehensive data integrations. |
Benefits and Limitations of Subscription Plans, Best org chart software
Subscription plans offer flexibility, allowing users to scale their features and user capacity as their needs change. However, limitations exist, including restricted access to advanced functionalities in lower tiers. These limitations often become apparent when users outgrow the basic features provided in lower-priced plans.Lower-tier plans often restrict the number of users, features, or storage space, which can be a significant limitation for growing organizations.
Higher tiers typically address these limitations by providing more comprehensive functionalities, including unlimited users, advanced analytics, and customization options.
Integration and Compatibility
Organizational chart software is more effective when seamlessly integrated with existing business tools. This integration streamlines workflows, reduces data redundancy, and improves overall efficiency. A robust integration strategy ensures data consistency across different platforms, eliminating the need for manual data entry and reducing the risk of errors. The ability to import and export data is crucial for maintaining a unified view of the organization and facilitates data sharing among departments.Effective integration allows for real-time updates, which is vital for accurate and current organizational information.
The software’s API support allows for custom integrations, enabling tailoring to specific business needs and expanding functionality beyond the standard features. The level of integration impacts the software’s overall value and its usefulness in supporting organizational growth and change.
Integration with Existing Business Tools
The ability of organizational chart software to integrate with project management software, communication platforms, and other business applications is critical. This integration allows for a unified view of the organization’s structure and activities, enabling better collaboration and communication. For example, project management data can be automatically linked to the organizational chart, providing a clear picture of team assignments and responsibilities.
This streamlined flow of information minimizes data silos and enhances transparency.
Data Compatibility
Maintaining data consistency across various systems is paramount. Inconsistent data can lead to inaccurate reporting, miscommunication, and inefficient workflows. The software should support various data formats and allow for seamless data exchange, ensuring that updates in one system are reflected across all integrated systems. This data compatibility is critical for accurate decision-making and informed strategic planning.
Import and Export Capabilities
The ease of importing and exporting data is crucial for maintaining data consistency. The software should support a variety of file formats (e.g., CSV, Excel, JSON) for seamless data transfer. This flexibility allows for easy migration from other systems and facilitates the sharing of organizational data with external stakeholders, such as partners or clients.
API Support for Custom Integrations
A robust API (Application Programming Interface) is essential for custom integrations. A well-documented API enables developers to build tailored integrations that address specific business needs. The level of API support should be clearly Artikeld to allow for flexibility and adaptability to evolving business requirements. A strong API allows developers to build integrations that enhance the software’s capabilities, expanding its functionality to meet the unique demands of different organizations.
Compatible Platforms
The ability to integrate with other platforms is a key factor in selecting organizational chart software. A wide range of compatible platforms ensures the software seamlessly integrates into existing workflows. This table Artikels some compatible platforms, but the specific options may vary based on the particular software.
| Software | Compatible Platforms | Description |
|---|---|---|
| Software A | Project Management Software (Asana, Jira), Communication Platforms (Slack, Microsoft Teams), CRM (Salesforce) | Supports seamless data exchange and real-time updates between different platforms. |
| Software B | Project Management Software (Trello, Monday.com), Communication Platforms (Microsoft Teams, Zoom), HRIS (BambooHR) | Offers bi-directional data synchronization for accurate and up-to-date information. |
| Software C | Project Management Software (ClickUp, Wrike), Communication Platforms (Google Workspace), CRM (HubSpot) | Provides robust API integration for custom development and integration with various systems. |
Customer Support and Resources

Finding the right organizational chart software often comes down to more than just features. A robust support system and readily available resources are crucial for navigating the complexities of any new tool. This section explores the diverse support options and helpful resources offered by different software providers, helping you choose a solution that best fits your needs.
Support Channels Offered
Different software providers utilize various channels to assist users. Understanding these options helps you determine the best approach for your support needs.
- Email Support: Many providers offer dedicated email addresses for user inquiries. This is a common and reliable method for submitting questions and receiving responses, often providing detailed explanations and solutions.
- Phone Support: Some vendors provide phone support, which can be beneficial for complex issues or when a quick resolution is required. This channel offers immediate clarification and direct interaction.
- Live Chat Support: Live chat support allows for immediate interaction and faster responses to basic queries. This is particularly useful for resolving straightforward issues or gaining quick clarification.
- Knowledge Base/FAQ: A comprehensive knowledge base or frequently asked questions (FAQ) section is a valuable resource. These resources often contain solutions to common problems, eliminating the need for extensive support interactions.
- Community Forums/Online Forums: Online forums or user communities provide valuable peer-to-peer support. Users can share experiences, offer solutions, and learn from others’ challenges, making the process more collaborative.
Support Quality and Effectiveness
The quality and effectiveness of customer support significantly impact the user experience. Reliable and prompt responses are key elements in determining the overall value of a software solution.
- Response Time: Quick response times to support inquiries indicate a responsive and efficient support team. A well-defined support process with clear escalation paths contributes to faster resolution.
- Problem Resolution: Effective support should provide clear and accurate solutions to user problems. Support teams should demonstrate a thorough understanding of the software and a commitment to finding effective resolutions.
- Support Staff Expertise: Support staff with a strong understanding of the software and its functionalities are more likely to provide accurate and helpful guidance. Regular training and updates on the software contribute to this expertise.
Availability of Online Resources
Online resources like tutorials, documentation, and video guides significantly improve user understanding and utilization of the software.
- Tutorials and Documentation: Well-written tutorials and comprehensive documentation provide step-by-step instructions and explanations of software features. This can significantly reduce the learning curve for new users.
- Video Guides: Video tutorials offer a visual representation of how to use specific features, making the learning process more engaging and effective. Visual demonstrations are especially helpful for users who learn better through observation.
- Interactive Training Modules: Some vendors provide interactive training modules to enhance the learning experience. These modules often provide quizzes and exercises to reinforce user understanding.
Comparison of Support Options
Different software vendors offer varying levels of support. Analyzing the range of support options allows for a more informed decision.
| Vendor | Email Support | Phone Support | Live Chat | Knowledge Base |
|---|---|---|---|---|
| Vendor A | Yes, prompt | Yes, available | Yes, limited hours | Extensive |
| Vendor B | Yes, responsive | No | Yes, 24/7 | Good |
| Vendor C | Yes, slow | No | No | Limited |
Support Process Flowchart
The following flowchart illustrates a typical support process. Note that variations may exist based on the specific vendor and issue.[A simple flowchart image would be inserted here. The flowchart should depict steps like:
- User submits a support request (email, ticket, etc.)
- Support team receives and logs the request.
- Support agent identifies the issue.
- Support agent researches and finds a solution.
- Support agent provides a solution to the user.
- User confirms resolution.
]
Examples of Real-World Applications
Organizational charts are more than just visual representations; they’re powerful tools for improving communication, collaboration, and efficiency within organizations. Choosing the right software to create and manage these charts can be pivotal in streamlining workflows and achieving business goals. Let’s explore how real-world organizations have leveraged organizational chart software to achieve tangible results.Effective organizational charts enable teams to understand reporting structures, identify key personnel, and facilitate clear communication channels.
This understanding leads to improved collaboration and task delegation, ultimately boosting productivity and achieving strategic objectives.
Successful Implementations Across Industries
Organizational chart software isn’t limited to a single industry; its application spans diverse sectors, from healthcare to technology. Here are some examples of successful implementations, highlighting how these tools have enhanced communication and collaboration within teams.
- Healthcare: A hospital system utilized organizational chart software to visualize the complex reporting structure across multiple departments. This clarity enabled seamless communication between doctors, nurses, and administrative staff, resulting in faster response times during critical situations. For instance, the software displayed the exact chain of command for notifying specialists in case of a specific emergency, which previously had been unclear and prone to delays.
The software addressed the challenge of navigating the intricate hospital hierarchy and fostered better collaboration among departments, improving patient care.
- Technology: A software development firm implemented an organizational chart to visualize project teams and their dependencies. The software made it easy to track project progress, identify bottlenecks, and reassign tasks effectively. The previous method, relying on spreadsheets, proved cumbersome and inaccurate. The software helped identify potential conflicts in schedules and resources earlier in the process, avoiding delays and reducing project costs.
- Retail: A large retail chain used organizational chart software to track employee performance and identify skill gaps. This analysis facilitated targeted training programs, ultimately improving customer service and sales figures. The company had previously relied on manual records that were difficult to analyze and update, hindering the identification of patterns and trends in employee performance. By visually representing the reporting structure and employee roles, the software addressed the need for a clear understanding of each employee’s responsibilities and their contribution to overall performance.
Specific Challenges and Solutions
Implementing organizational chart software often involves overcoming specific challenges. Let’s look at how the software addresses these issues.
- Maintaining Accurate Information: Software solutions usually provide robust features for data entry and updates. Real-time data synchronization and automatic alerts on changes ensure that the chart remains current and accurate, reflecting any organizational restructuring. This eliminates the risk of outdated or incorrect information, which could hinder decision-making and collaboration.
- Integration with Existing Systems: Many software options seamlessly integrate with existing CRM, HR, or project management systems. This unified view of data facilitates more comprehensive insights and avoids the need for manual data entry, reducing errors and improving overall efficiency. A successful integration allows for a holistic understanding of organizational processes, including team assignments, project dependencies, and employee performance.
Case Studies and Success Stories
While detailed case studies are not readily available for public access, numerous organizations have reported significant improvements in communication and collaboration after implementing organizational chart software.
- Improved Communication: By visualizing the chain of command and reporting structures, the software enabled clearer communication channels. This reduced ambiguity and improved coordination among teams, leading to a more efficient workflow.
- Enhanced Collaboration: Teams could quickly identify their colleagues and relevant contacts within the organization. This facilitated smoother collaboration, enabling effective knowledge sharing and task delegation, ultimately boosting overall team performance.
Closing Notes: Best Org Chart Software
In conclusion, the best org chart software empowers teams to visualize their structure and optimize workflow. By considering features, user experience, pricing, and integration capabilities, you can select a solution that aligns with your specific team needs. The right software can significantly enhance communication, collaboration, and overall efficiency. Choosing the right org chart software is a key step in creating a well-structured and effective team.